Beginner
Completing a learning experience
Launch an assigned scenario, work through it, chart your notes, and review your results.
Release 18What's changed on this pageEverything new →
01Launch your scenario
1
Open the Learning Experience tab
Sign in to OnScreen and open the Learning Experience tab to see the scenarios your instructor assigned. Find yours and select Learner.
.png)
2
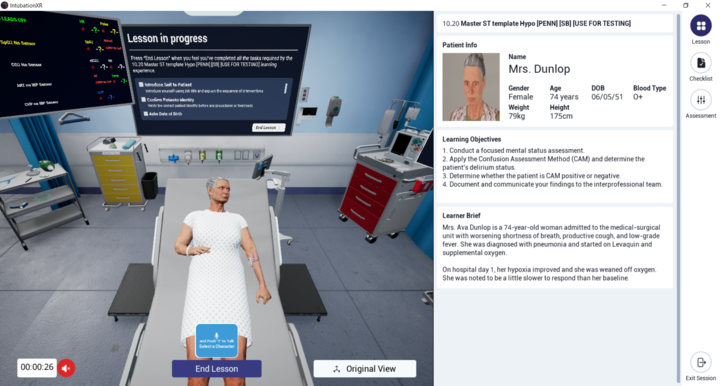
Read your learner brief
When the scenario loads, your learner brief appears. It covers your clinical role, the patient background, and your learning objectives. Read it before you begin.
02Work through the learning experience
Updated
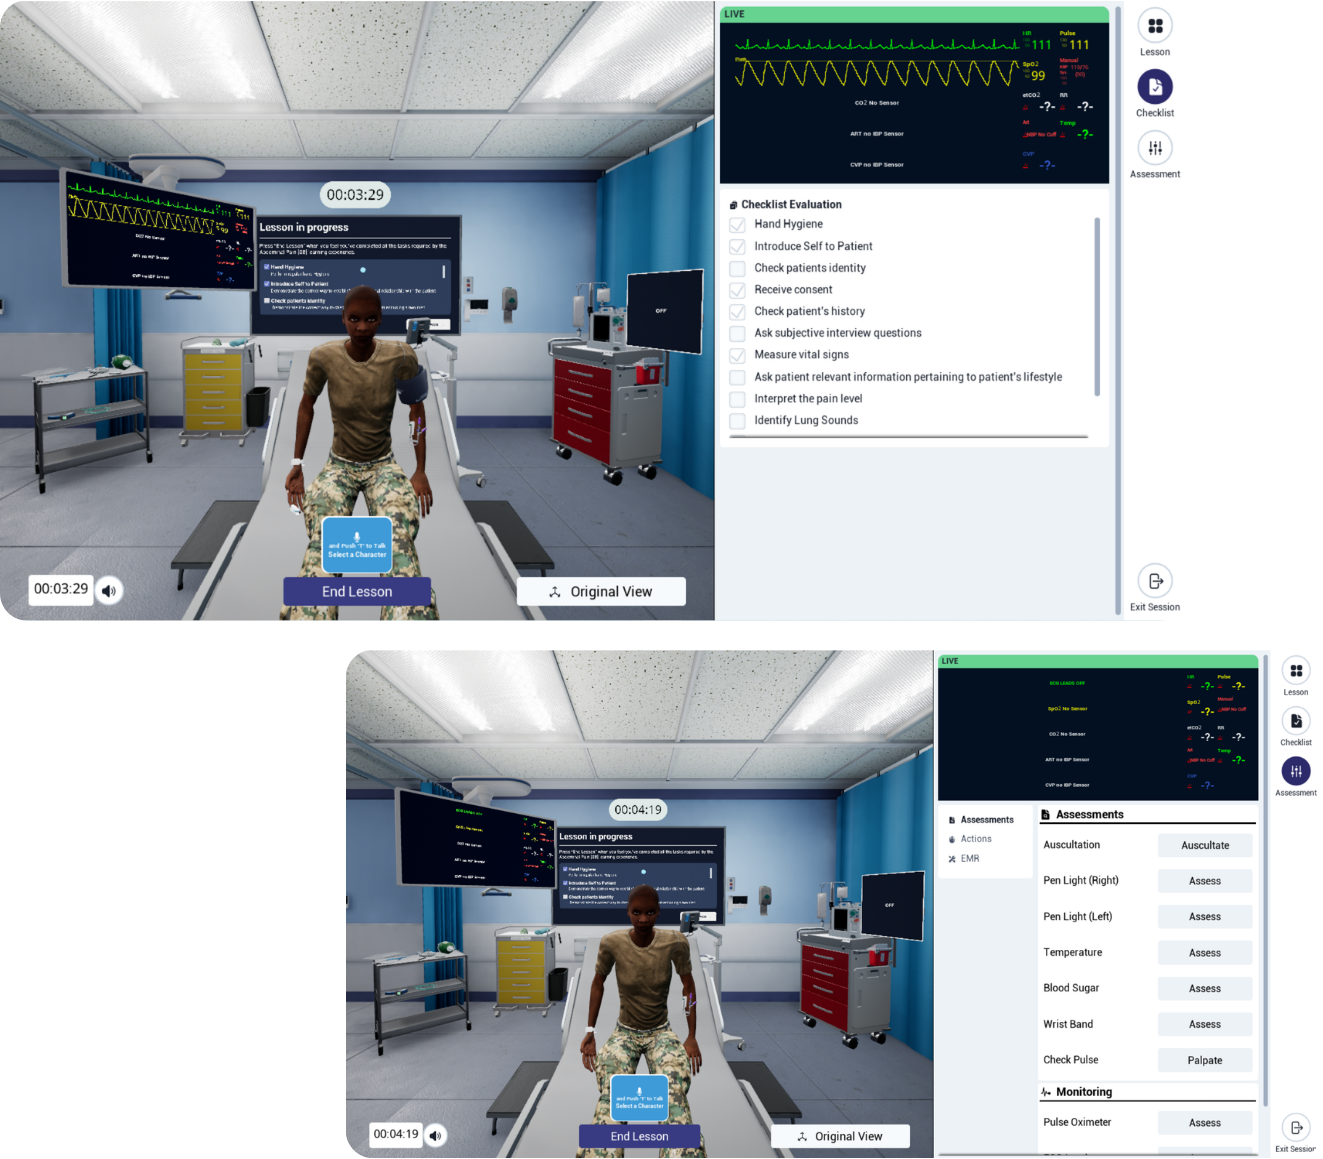
Assess and treat your patient
Open the Assessments, Actions, and EMR menus on the right to examine and treat your patient. The checklist at the top left shows the tasks still to do. In self-directed sessions, each item has a short description so you know what's expected. To speak to a character, press and hold T.
New to the controls? See Navigating a learning experience.
💡
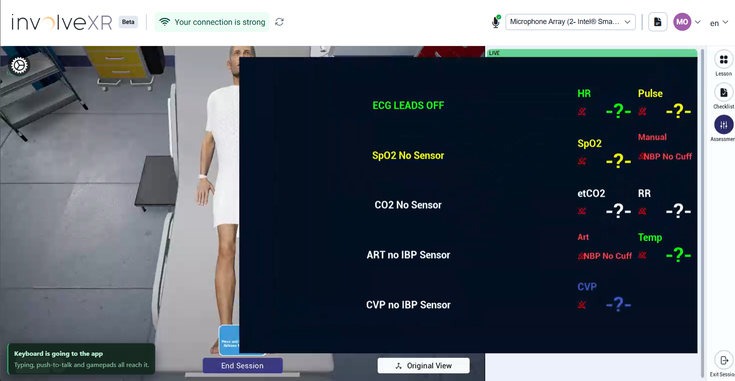
Watch the live monitor
The monitor at the top right shows the patient's vitals as they change. Hover over it to magnify it.

03Chart your notes
Charting closes the loop on your clinical reasoning. Do it during the scenario or after.
Option 1: chart inside the scenario
In the Assessment menu, select EMR, then View to open the EMR tablet. Go to Charting and complete your SOAP or SBAR notes.
Option 2: chart after the session
After you end the session, open your email and select Complete Charting Now. In the Web Portal, scroll to Charting and complete your Subjective, Objective, Assessment, and Plan notes.
.png)
⭐
Best practice
Always chart. It captures your full learning experience and supports your clinical reasoning.
04Finish the session
Updated
Press End Session
When you've completed the tasks, press End Session. You'll see a closing message and your first feedback, including the safe practices you followed and any unsafe practices you avoided or missed.
.png)
ℹ️
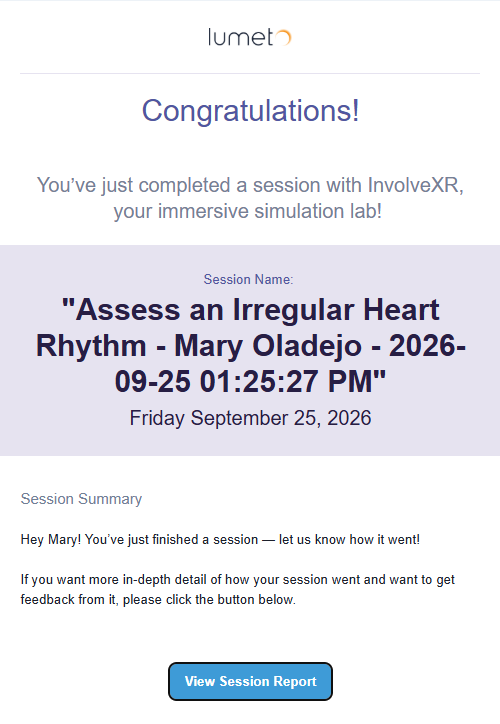
Check your email
In self-directed sessions, your session report is emailed to you automatically when the session ends, in VR and on screen. You'll also get a summary email. Select View Session Report to see your full results.
05Review your session report
Read your full report
Open it from View Session Report in your email, or from the Web Portal.
In your report you can
- Review your overall score
- See your safe and unsafe practices
- Read your AI-powered assessment feedback
- Open the event log
- Read the full conversation transcript
.png)
💡
Tip
Use your report to spot strengths, close gaps, and prepare for your next session.
06See your full history
Open the Sessions tab
Go to healthcare.portal.lumeto.com and open the Sessions tab. Open any session to see your score, practices, transcript, and more.
.png)
ℹ️
Track your progress
The Learner Performance chart plots your scores across recent sessions.
🎉
That's a full learning experience.
Run another to build on what you've learned.
-1.png?width=150&height=66&name=Lumeto%20Logo%20Reverse%20Transparent%20(1)-1.png)